Home


The legal mandate and core business of the Department of Forestry, Fisheries and the Environment (DFFE) are to manage, protect and conserve South Africa’s environment and natural resources. The mandate is informed by section 24 of the Constitution of the Republic of South Africa, 1996 (Act No. 108 of 1996), which affords everyone the right to (a) an environment that is not harmful to their health or well-being; and (b) to have the environment protected for the benefit of present and future generations, through reasonable legislative and other measures.
To give effect to this constitutional environmental right and the need for sound environmental management and sustainable development, the DFFE has over a period of time developed a comprehensive environmental management legislative/regulatory framework. This regulatory framework comprises acts of parliament (environmental laws), regulations, policies, norms and standards, and other regulatory tools that are aimed at promoting sound environmental management practices in order to protect and conserve the environment for the benefit of current and future generations.
In addition to the development, implementation and ongoing review of a progressive regulatory framework for sound environmental management, other critical environmental management interventions by the DFFE include raising awareness on key environment issues and promoting a culture of environmental activism among ordinary citizens, building capacity within the sector, and establishing and strengthening national, regional and global partnerships to address common environmental challenges.
Vision
A prosperous and equitable society living in harmony with our natural resources.
Mission
Providing leadership in environmental management, conservation and protection towards sustainability for the benefit of South Africans and the global community.
Values
We are driven by our Passion as custodians and ambassadors of the environment, we have to be Proactive and foster innovative thinking and solutions to environmental management premised on a People-centric approach that recognises the centrality of Batho Pele, for it is when we put our people first that we will serve with Integrity, an important ingredient in a high Performance-driven organisation such as ours.
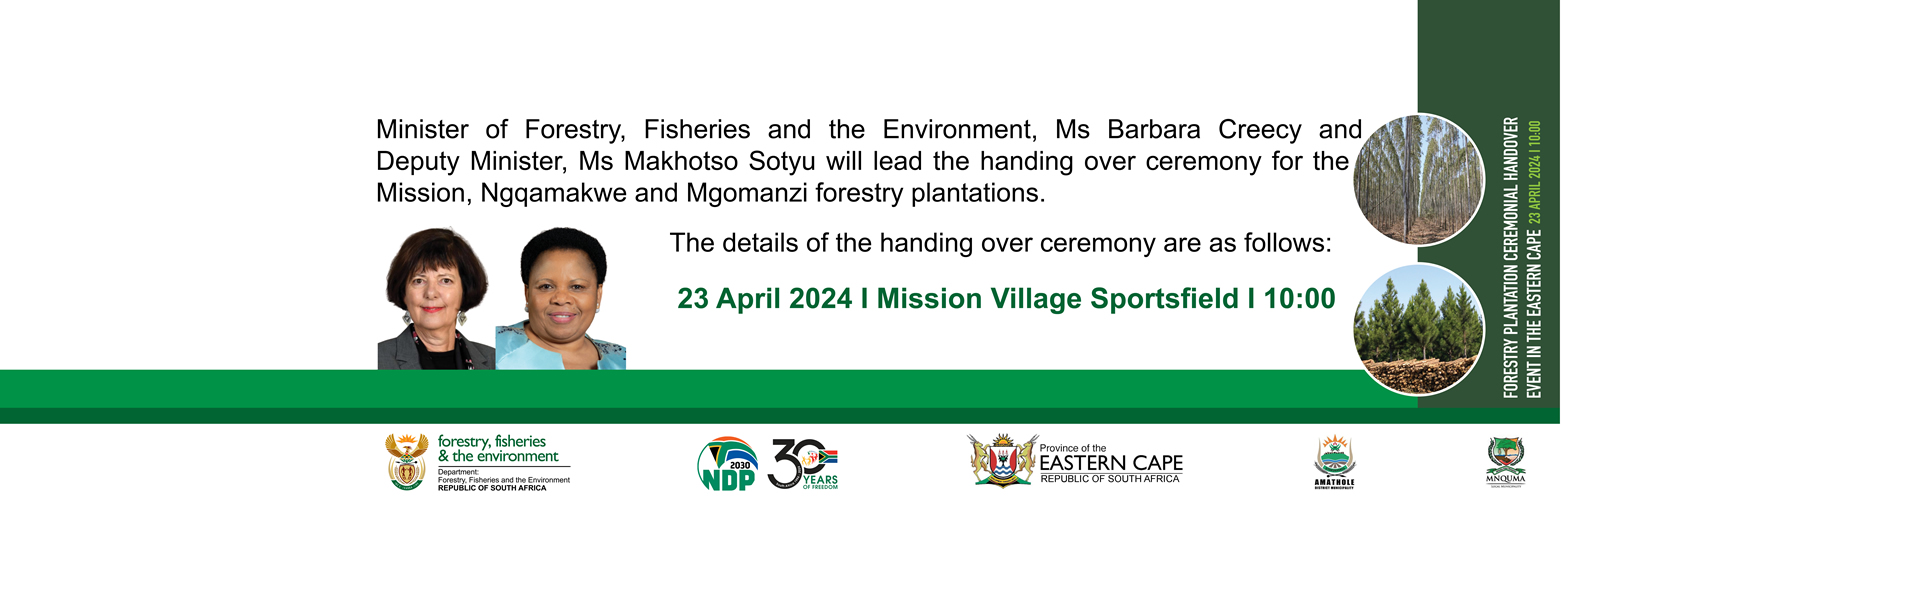
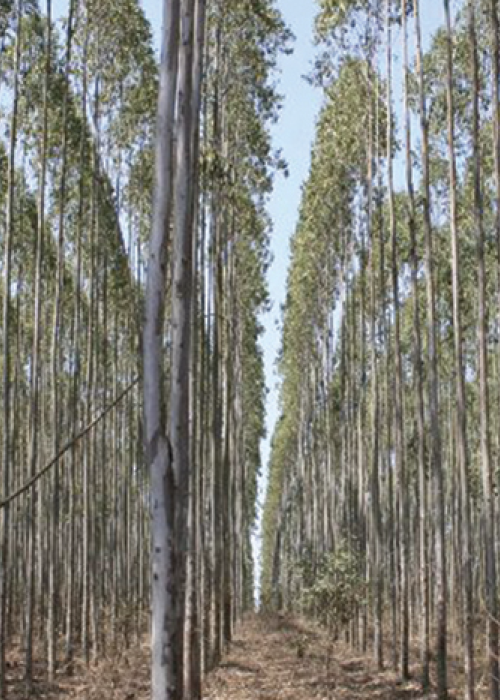
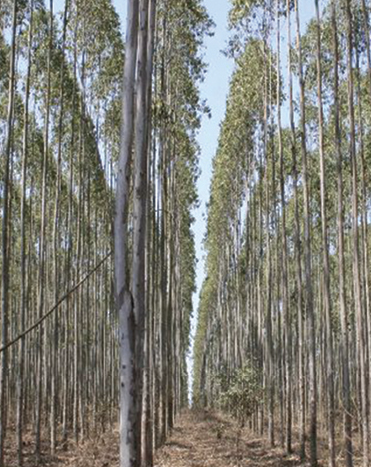
Deputy Minister M Sotyu: Launch community forestry agreements and handover ceremony of Mission, Nqamakwe and Mgomanzi plantations to Tobotshane, Amahlubi and Amazizi traditional councils
Butterworth, Mnquma Local Municipality, Amathole District Municipality,

Minister B Creecy: Launch community forestry agreements and handover ceremony of Mission, Nqamakwe and Mgomanzi plantations to Tobotshane, Amahlubi and Amazizi traditional councils
Butterworth, Mnquma Local Municipality, Amathole District Municipality,


